Visual style exploration#
Most learning materials rely on printed text to provide information. As a visual learner, find ways to represent information visually. Here are some ways you can do this:
-
Use diagrams, graphs and sketches. If you can’t find good diagrams, graphs and sketches that represent the key messages in your topics, create them yourself. Just start drawing, even if you don’t think you draw well. In addition, easily accessible spreadsheet programs now allow you to create graphs for all kinds of data.
-
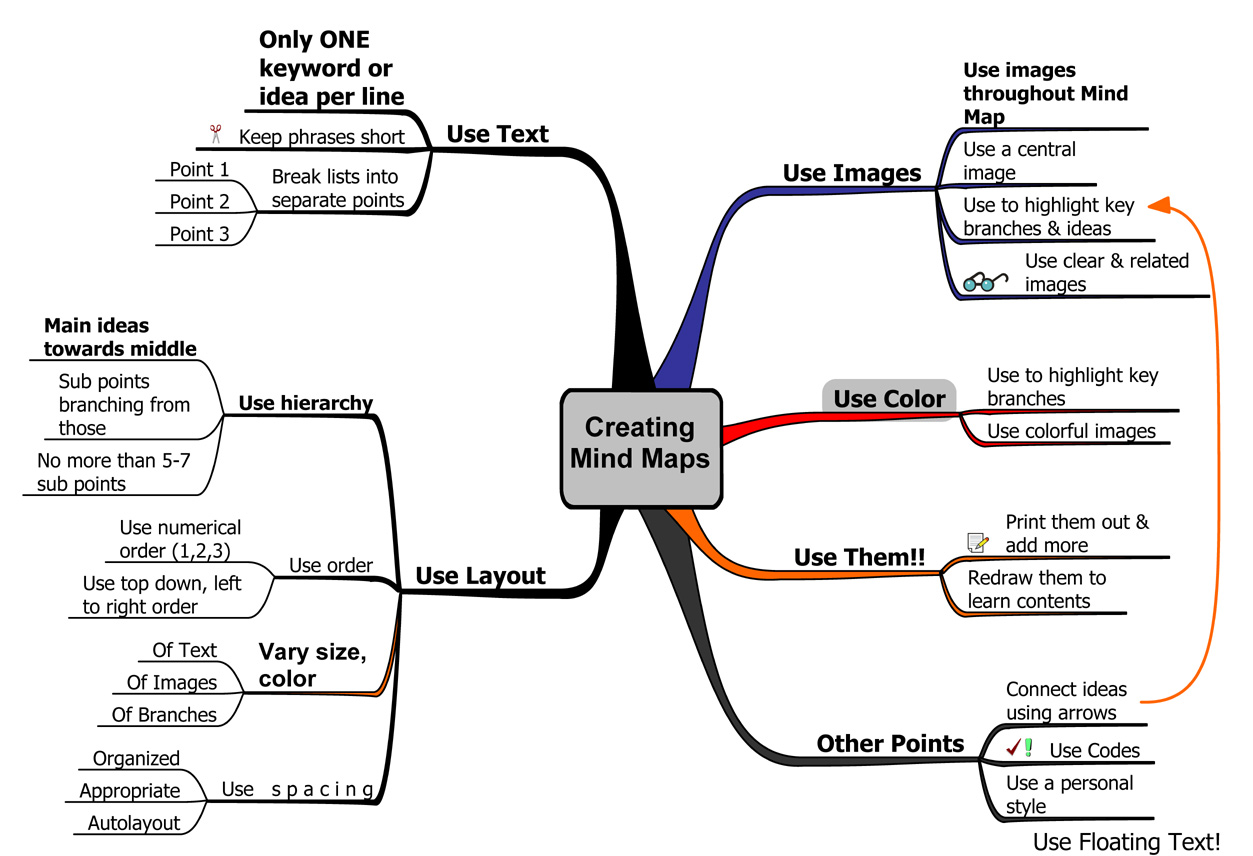
Use Mind Maps(R). Organize topics and ideas using a drawing technique called mind mapping. This helps you visualize and understand the hierarchy and linkages between topics. Tony Buzan, in some of his books, describes this technique in detail. In addition, some software programs can help you easily create mind maps. The software I use is “Mind Manager” from MindJet. Rather than describe mind maps in detail, I’ll let my mind map below do it for me.
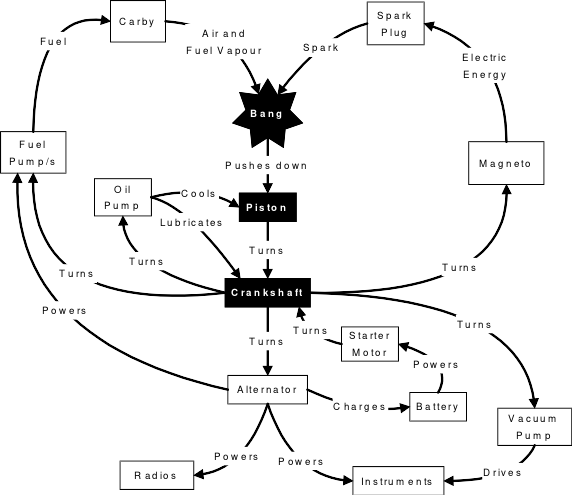
- Use systems diagrams. Systems diagrams are another diagramming technique you can use to help understand a dynamic system, such as an engine, body, yacht or network. The traditional way of dissecting something into separate parts, to understand their roles, often makes it harder to understand the system. For example, it’s hard to understand the workings of the human body by simply looking at the individual parts. Similarly, understanding how a yacht stays in equilibrium under full sail is hard if you only look at the sail, rudder, keel and hull individually.
The linkages between multiple parts are usually what make these dynamic systems work. These linkages may not be visible when the system is lying in bits on the floor, or in separate topics in your mind. Systems diagrams help show and explain those linkages. The diagram below is an example of a systems diagram. It shows how various parts of an aircraft engine work together.
- Use visualization. Use the visualization techniques outlined in the Memletic Techniques chapter to help understand various topics. If you can visualize a topic clearly and precisely, you should have a good understanding of it. If some areas appear grey or fuzzy, this suggests you still have some further work to do to understand it fully.